prof2-I
Note
This script requires matplotlib and wxWindows.
Interactive parametrisation explorer
prof2-I IPOLFILE <options>
Or, to also draw data:
prof2-I IPOLFILE DATADIR <options>
Options:
--wfile # Specify a weight file to limit plotting to a subset of observables
Example:
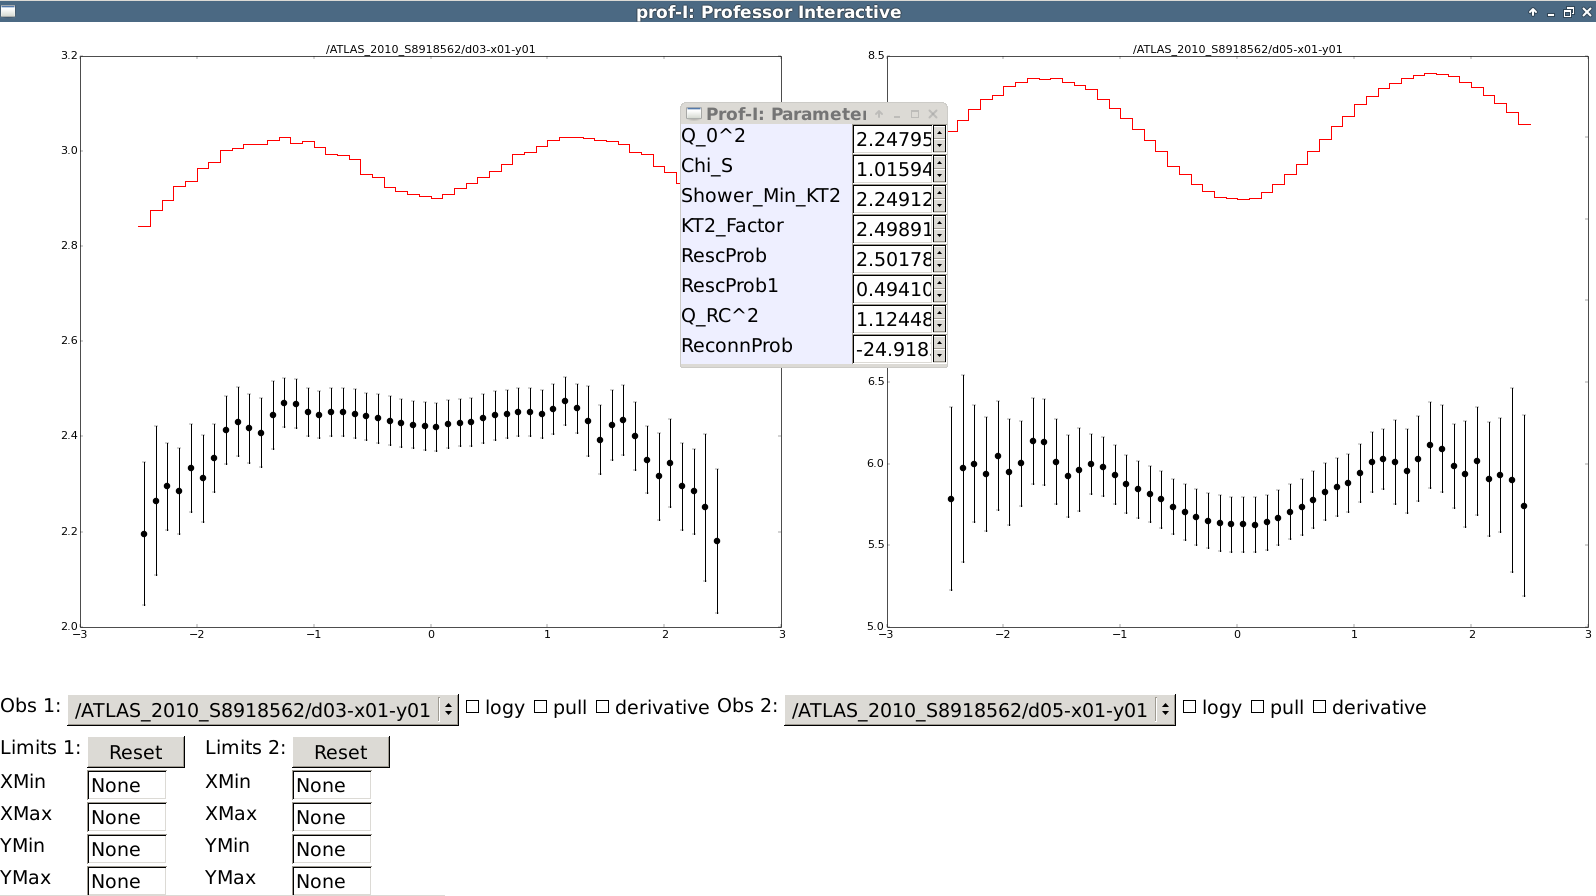
- The red line is the parametrisation for a parameter point set with the dials in the second window
- Optionally, data can be plotted
- The histograms to be shown can be selected from the drop-down menu