prof2-sens
Sensitivity plots based on gradients. Requires matplotlib.
prof2-sens IPOLFILE <options>
IPOLFILE must point to a parametrisation file (output file of prof2-ipol).
Options:
-o      # Specify output folder
--wfile # Specify a weight file to limit plotting to a subset of observables
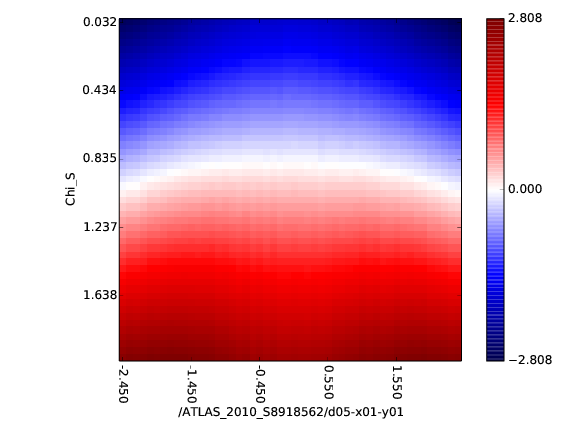
Example:
- x-axis: bins of a histogram
- y-axis: a parameter axis
- z-axis: in color coding the derivative of each bin at the y-axis coordinate